ETL Batch Processing Project - No-Show Appointment
Batch ETL pipeline analyzing hospital appointment no-show trends across age, SMS prompts, and welfare enrollment. GCP • PySpark • BigQuery • Looker Studio
Project Description
This project seeks to investigate hospital appointments no-show trends. is attendance a function of age, ailment type or proximity to the hospital? It may also be that SMS prompt play a vital role in helping people honor hospital appointments.
Questions for Analysis
What age ranges are more likely to honor appointments as well as the ages that most likely wouldn’t?
Does SMS prompts play an important role in appointment showup rates?
What percentage of males and females are enrolled in welfare programs?
Objective
To satisfy an end-to-end data engineering life cycle.
Technology Stack
The following technologies are used to build this project
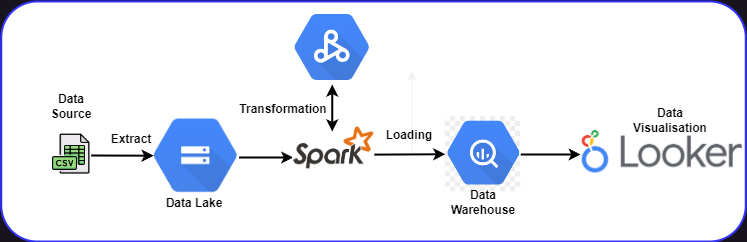
Google Cloud Storage (GCS) - as Data Lake
PySpark - for transformation and data modeling
Google BigQuery - for Data Warehouse
Google Looker studio - for visualizations
Data Pipeline Architecture
Reproduce it yourself
First clone this repo to your local machine.
git clone https://github.com/Khunmi/Capstone-Project---Data-Engineering-ZoomCamp
Setup your Google Cloud environment
Create a Google Cloud Platform project
Configure Identity and Access Management (IAM) for the service account, giving it the following privileges:
Viewer
Storage Admin
Storage Object Admin
BigQuery Admin
Download the JSON credentials and save it, e.g. to
~/.gc/<credentials>Install the Google Cloud SDK
Let the environment variable point to your GCP key, authenticate it and refresh the session token
export GOOGLE_APPLICATION_CREDENTIALS=<path_to_your_credentials>.json
gcloud auth activate-service-account --key-file $GOOGLE_APPLICATION_CREDENTIALS
gcloud auth application-default login
Check out this link for a video walkthrough.
Setup the necessary dependencies to run Apache Spark and interact with it using Pyspark within your local machine. This will be needed because I used pyspark for transformation and schema design for this project. See here for an instructional guide.
Create a pipeline that loads your parquet files from an API to your Data Lake just as seen here
Create a compute engine instance on Google cloud to enable you run a dataproc job within a serverless environment which also gives the felxibility of scheduling. See here for a video guide.
Upload your python script containing your Spark job script to GCS and run your compute engine from the command line using the code below. Make sure you edit all parts that references my google cloud configurations to yours.
gcloud dataproc jobs submit pyspark \
    --cluster=de-zoomcamp-cluster \
    --region=northamerica-northeast2 \
    --project=khunmi-academy-376002 \
    --jars=gs://spark-lib/bigquery/spark-bigquery-latest_2.12.jar \
    gs://dtc_data_lake_khunmi-academy-376002/code/capstone_proj.py \
    -- \
        --input_data=gs://dtc_data_lake_khunmi-academy-376002/capstone/ \
        --output=trips_data_all.capstone2023
Google Data Studio: To generate insights from my dataset, I connected my data source located in my data warehouse(Bigquery). You can interact with the dashboard below.
Dataset Description
This dataset collects information from 100k medical appointments in Brazil and is focused on the question of whether or not patients show up for their appointment. A number of characteristics about the patient are included in each row.‘ScheduledDay’ tells us on what day the patient setup their appointment.‘Neighborhood’ indicates the location of the hospital.‘Scholarship’ indicates whether or not the patient is enrolled in Brasilian welfare program Bolsa Família:
|  | Variable|                Data_ Type|
|1.| PatientId|                   float64|
|2.| Appointment|                 IDint64|
|3.| Gender|                       object|
|4.| ScheduledDay|                 object|
|5.| AppointmentDay|               object|
|6.| Age|                           int64|
|7.| Neighbourhood|                object|
|8.| Scholarship|                   int64|
|9.| Hipertension|                  int64|
|10.| Diabetes|                     int64|
|11.| Alcoholism|                   int64|
|12.| Handicap|                      int64|
|13.| SMS_received|                 int64|
|14.| No-show |                    object|
Future work
Getting more comfortable using Ifrastucture as code within my project such as Terraform
Including an orchestartion to make my process more automated such Prefect or Airflow
Add more tests
Add CI/CD pipeline
Make incremental model, to append only the latest data from each load
Transformations, documentation and data quality tests in dbt
Streaming process with Kafka and Spark